
1. How do I understand the Storewide Overview data?
Storewide Overview consists of the key metrics and the recommended optimizations that you can make to your Sponsored Discovery campaigns to maximize their ability to drive traffic and/or sales for your store.
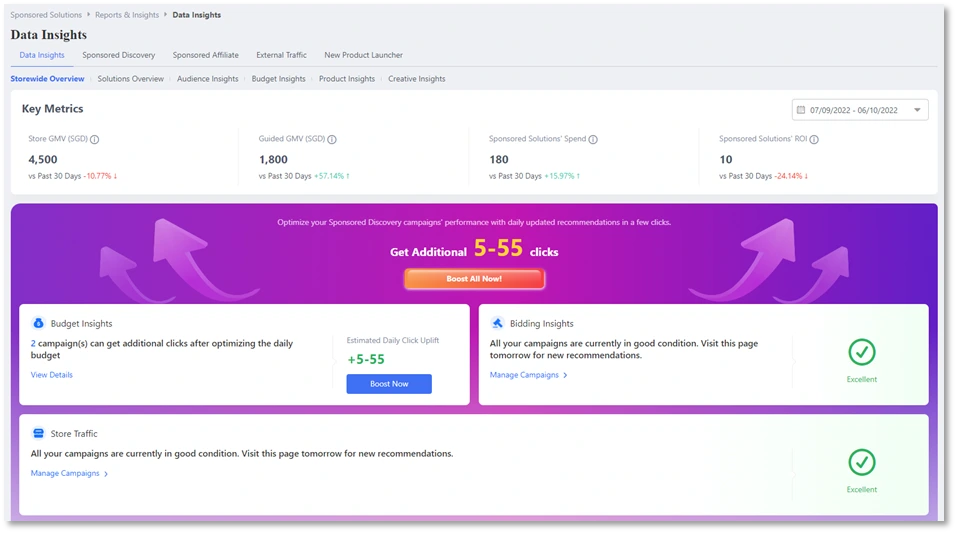
Key Metrics
•Store GMV: Total buyer paid value during the selected period
•Guided GMV (SGD): GMV generated via Sponsored Solutions (Display, Discovery, Max)
•Sponsored Solutions’ Spend (SGD): Amount spent on Sponsored Solutions (Display, Discovery, Max)
•Sponsored Solutions’ ROI: Sponsored Solutions’ return on investment (ROI) shows how efficient your Sponsored Solutions’ spend is in driving revenue for your store.
Overall store optimization suggestions that Sponsored Discovery campaigns can drive
•Budget insights: Check out how your budgets are affecting your
•Sponsored Discovery campaigns’ clicks and apply the suggested budgets for more optimal results.
•Bidding insights: View suggested bids that will allow you to bid at a more optimal level to unlock more clicks from shoppers who are searching and browsing through recommendations
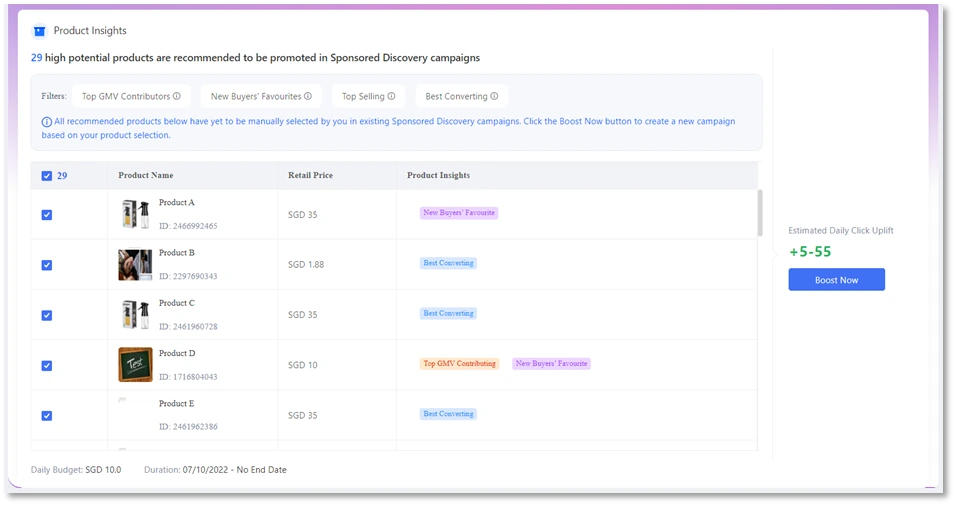
•Product selection insights: View how automation with the automated product selection helps you match your products with interested shoppers in the ever-changing shoppers’ behavior. Check out the impact or clicks by using/re-enabling the setting compared to not using the automated product selection.
•More product selection insights: Select products that are more likely to sell that are not manually selected yet into your campaign yet. Refer to the screenshot below for the relevant section. The products selected will be added to an automated campaign.
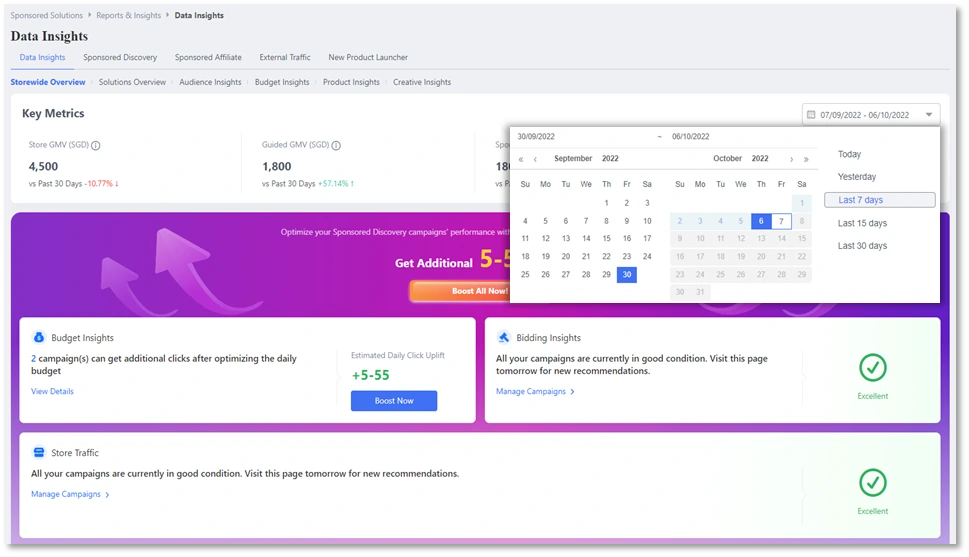
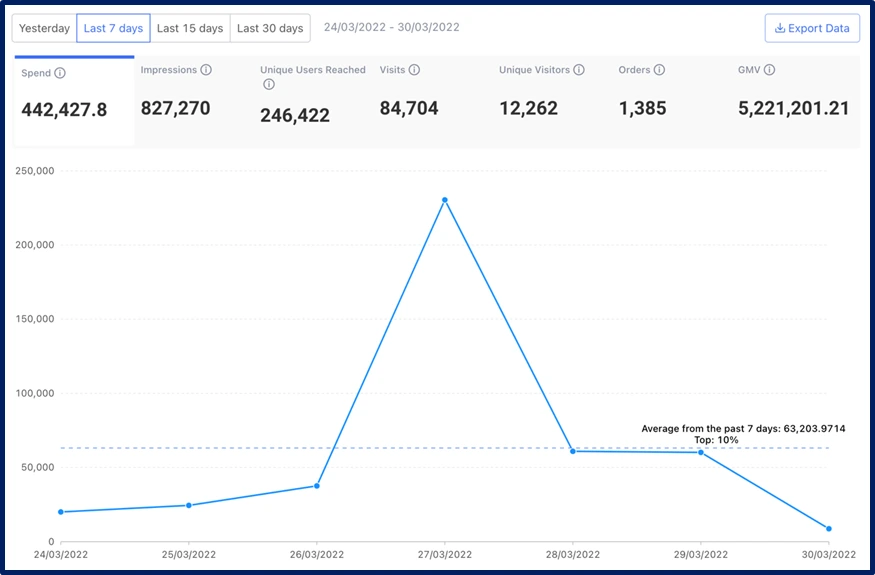
2. Can we select a customized date range?
Yes, you may now select a customized date range by selecting the date selector tool shown in the screenshot below.
1. How do I understand the Solution Overview data dashboard?
Solutions Overview dashboard provides an combined overview of all Sponsored Solutions utilized in your store, in a single line chart.
2. How to understand the each of the 7 metrics in the Solutions Overview page?
| Metrics | Definition |
| Spending | Total amount of credits that were spent on Sponsored Max, Discovery, and Display. |
| Impressions | Total number of times your promoted product was shown to shoppers via Sponsored Discovery and Display. Sponsored Affiliate and Display assets that were booked via offline methods (i.e., not via LSS Centre) will not be included. |
| Reached Unique User | Total number of unique users who have seen your promoted products via Sponsored Discovery and Display.Eg. If one user has seen your promoted products3 times in the specified period, he/she will be counted as1 Reached Unique User regardless of the number of times he/she has seen promoted product. |
| Visits | Total number of visits to your Store and Product pages that can be traced back to clicks or exposure via Sponsored Display, Sponsored Discovery, and Sponsored Max. Detailed criteria: |
| Unique Visitors | Total number of unique users who have viewed your Store and Product pages that can be traced back to clicks or impressions on Sponsored Display, Discovery, and Max. Please note that the number shown here is de-duplicated, e.g., if a user visited3 times after exposure to Sponsored Display banners and clicking on Sponsored Discovery placements, he will be counted as1 Unique Visitor (regardless of number of times visited or Marketing Solutions channel used). |
| Orders | Total number of orders generated that could be attributed to Sponsored Solutions (Display, Discovery, Max), de-duplicated across solutions. |
| GMV | Total buyer paid value of orders generated that could be attributed to Sponsored Solutions (Display, Discovery, Max), de-duplicated across solutions. |
3. Does the combined data include all Sponsored Solutions?
Solution Overview dashboard provides the combined total data of:
• Sponsored Discovery
• Sponsored Max
• Sponsored Display campaigns that were set up via Lazada Sponsored Solutions Centre.
It does not include data from:
• AMS Sponsored Affiliates (ie. Sponsored Affiliate campaigns that were set up and ran via Marketing Solutions Portal)
• Sponsored Display campaigns that were booked via offline methods (ie. not through Lazada Sponsored Solutions Centre).
Remark: Starting July 15, 2025, metrics in Data Insight for On-Platform Solutions will no longer include Sponsored Affiliate data. (Data prior to this date will remain unchanged and continue to include Sponsored Affiliate performance.)
4. What is the ‘Average’ and ‘Top 10%’ indicated in the line chart referring to?
Average indicates the average figure of the key metrics in the date range selected.
For example, if you’re viewing the GMV from the past 7 days, the average GMV from those 7 days will be shown in the form of a dotted line in the chart (A), as well as the actual value (B) in the caption.
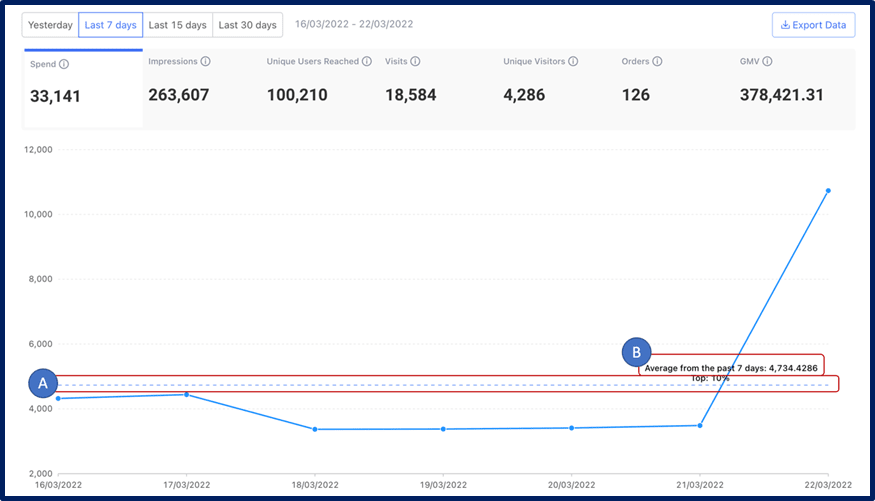
It will also show how your Store performance ranks in comparison to all others in the same product category.
This ranking is calculated based on the averaged value of the selected metric compared to the other advertisers in the same venture & sharing the same main product category
In this example, the ‘Top 10%’ indicates that your Spend is within the Top 10% of all other sellers in your main product category (eg. Toys).
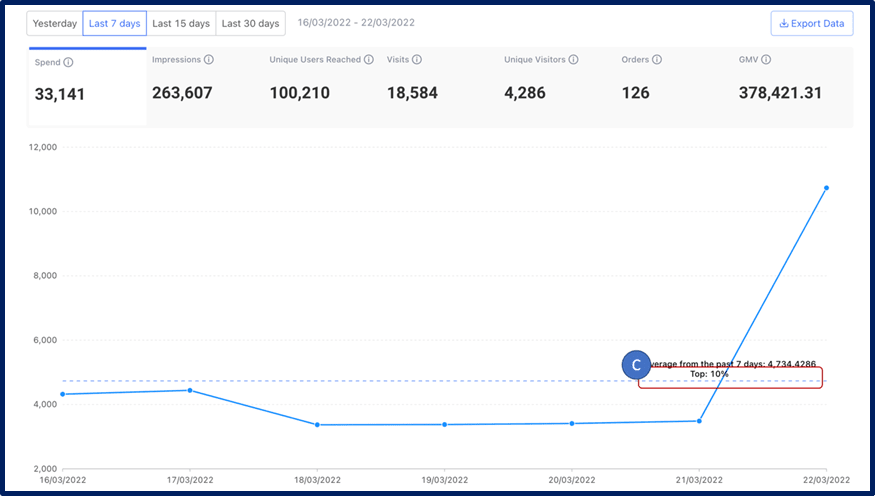
Possible options you may see here are:
• Top 10%
• Top 10 – 50%
• Below Average (if your ranking falls below 50% of all sellers in your category)
5. I am only using one Sponsored Solution, which is Sponsored Discovery. The ‘Visits’ & ‘Unique Visits’ that I see in the Sponsored Discovery dashboard does not match the ‘Clicks’data I see in the Solutions Overview page. Why is this happening?
For Visits in the Solutions Overview, the number is expected to be larger than the Click number shown in Sponsored Discovery reporting because, the Visits number here include any Page Views from the Sponsored Discovery click and any following page views by the same user in the same session. So if a user clicked on Sponsored Discovery placement and landed on Product Page, then the same user then clicked into the store page of this product, and further clicked on other Product Page of products under this store. Then in this case, the Sponsored Discovery click number shown in Sponsored Discovery reporting is recorded as 1, but the Visits in Solutions Overview is recorded as more than 1.
Unique Visitors number is the de-duplicated number of Visits on user level. This number should be less than the click number in Sponsored Discovery reporting, because in Sponsored Discovery reporting, we count all clicks generated regardless they are from the same user or not.
6. Why do I see a warning message in this page?
This warning message will appear if there were no store visits recorded within the date range you selected. Please check again when there is sufficient visits to store.
7. The Orders & Gross Merchandise Value (GMV) shown in Solutions Overview page does not seem to match the numbers shown in the individual Sponsored Discovery/Max/Display pages in Lazada Seller Centre. Which number should I refer to?
This is due to differences in the way Solutions Overview dashboard and Lazada Seller Centre dashboard defines and/or tracks the date of Order.
• Solutions Overview dashboard (Data Insights): Displays the value of Order & Gross Merchandise Value (GMV) attributable to Sponsored Solutions, that were generated on the selected dates itself.
• Sponsored Discovery dashboards in Lazada Seller Centre: Displays the value of Order & Gross Merchandise Value (GMV) attributable to Sponsored Solutions, that were generated as a result from the clicks made on the selected date.
Example:
• 1 Oct: User A clicked on a Sponsored Discovery placement of SKU B
• 6 Oct: The same user (User A) places an order for SKU B
In this case, Solution Overview dashboard will record this Order and Gross Merchandise Value (GMV) on 6th October.
Sponsored Discovery dashboard in Lazada Seller Centre will record this Order and GMV on 1st October.
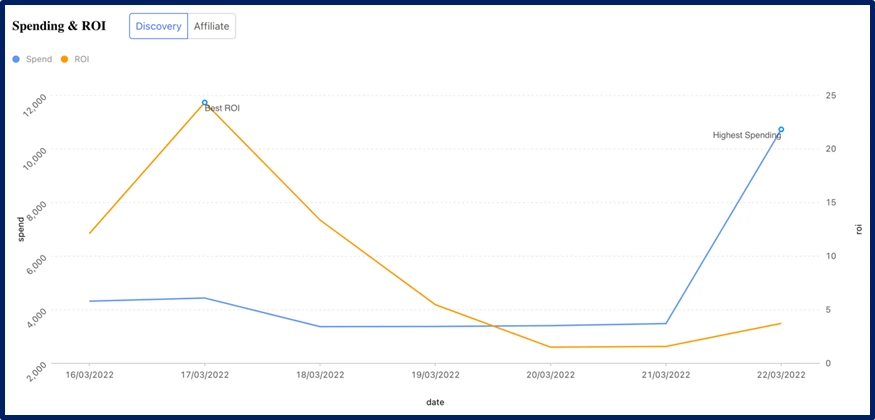
1. How do I read the data from the Budget Insights dashboard?
Budget Insights dashboard provides daily trends of ROI, Spend, and GMV achieved using Sponsored Max, and Sponsored Discovery.
You may toggle between Sponsored Max and Sponsored Discovery to see each solutions’ achievements.
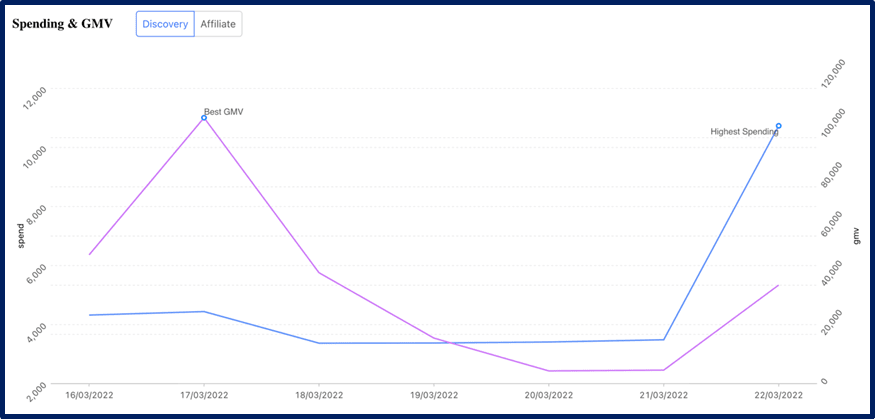
2. In the Spending & GMV Chart, what is the definition of GMV? Is it the overall store’s total GMV, or just the GMV achieved using Sponsored Solutions?
GMV in this chart (indicated in purline line) refers to the total GMV that can be attributed to the usage of the Sponsored Solution selected in the toggle window (Sponsored Discovery, or Sponsored Max). It is NOT a combined total of the two solutions, nor the measurement of the overall store GMV.
3. When I click on ‘Optimize Now’, some Sponsored Discovery campaigns appear in the pop-up window. Why am I seeing these campaigns, and what is the criteria used by Lazada to select these campaigns?
These are the list of campaigns that have paused due to reaching its daily budget cap, within the date range you selected (eg. past 7 days). These campaigns may benefit from closer review & adjustment of the budget, so that it does not pause prematurely due to insufficient budget in the future.
1. How do I read the data in the Product Insights dashboard?
Product Insights dashboard includes two charts:
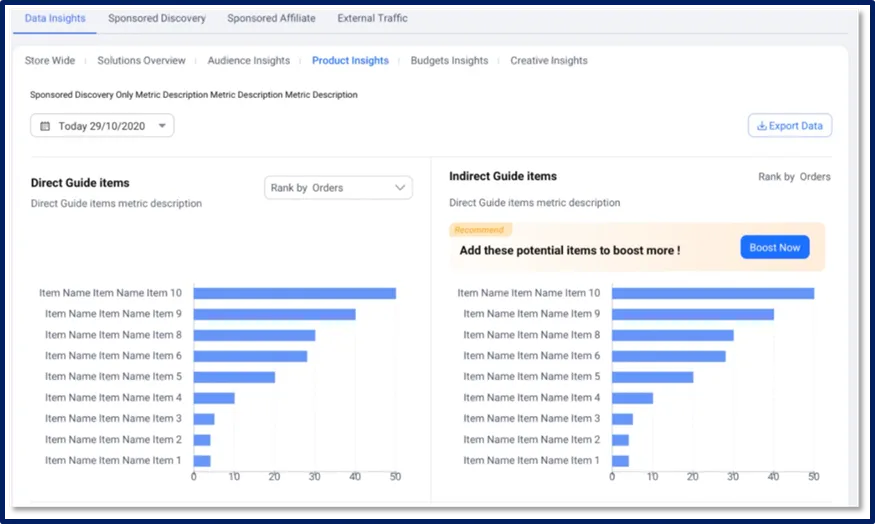
– Directly Guided Products
Ranking of products that achieved the most conversions (purchases) after shoppers clicked on its Sponsored Discovery placements (eg. Search result). From this chart, you can identify which products have the best Sponsored Discovery performance.
– Indirectly Guided Products
Ranking of products that you currently did not include in any of your Sponsored Discovery campaigns, but are getting purchased by shoppers who clicked on Sponsored Discovery placements for other products from your store.
eg. Shopper A may have clicked on the Sponsored Discovery placement for an Air Purifier, but subsequently navigated to an Air Fryer product in your store and ultimately purchased it within 30 days from the first click.
These could be high-potential, high-demand products that you may wish to consider adding to your Sponsored Discovery campaign for better campaign performance and ROI.
2. Which solutions are included in Product Insights dashboard?
Product Insights Dashboard includes data from Sponsored Discovery only.
It does not include data from any other Sponsored Solutions
3. Can we select a customized date range?
For the time being, date ranges can only be selected for: Yesterday, 7 days, 15 days, and 30 days ranges.
