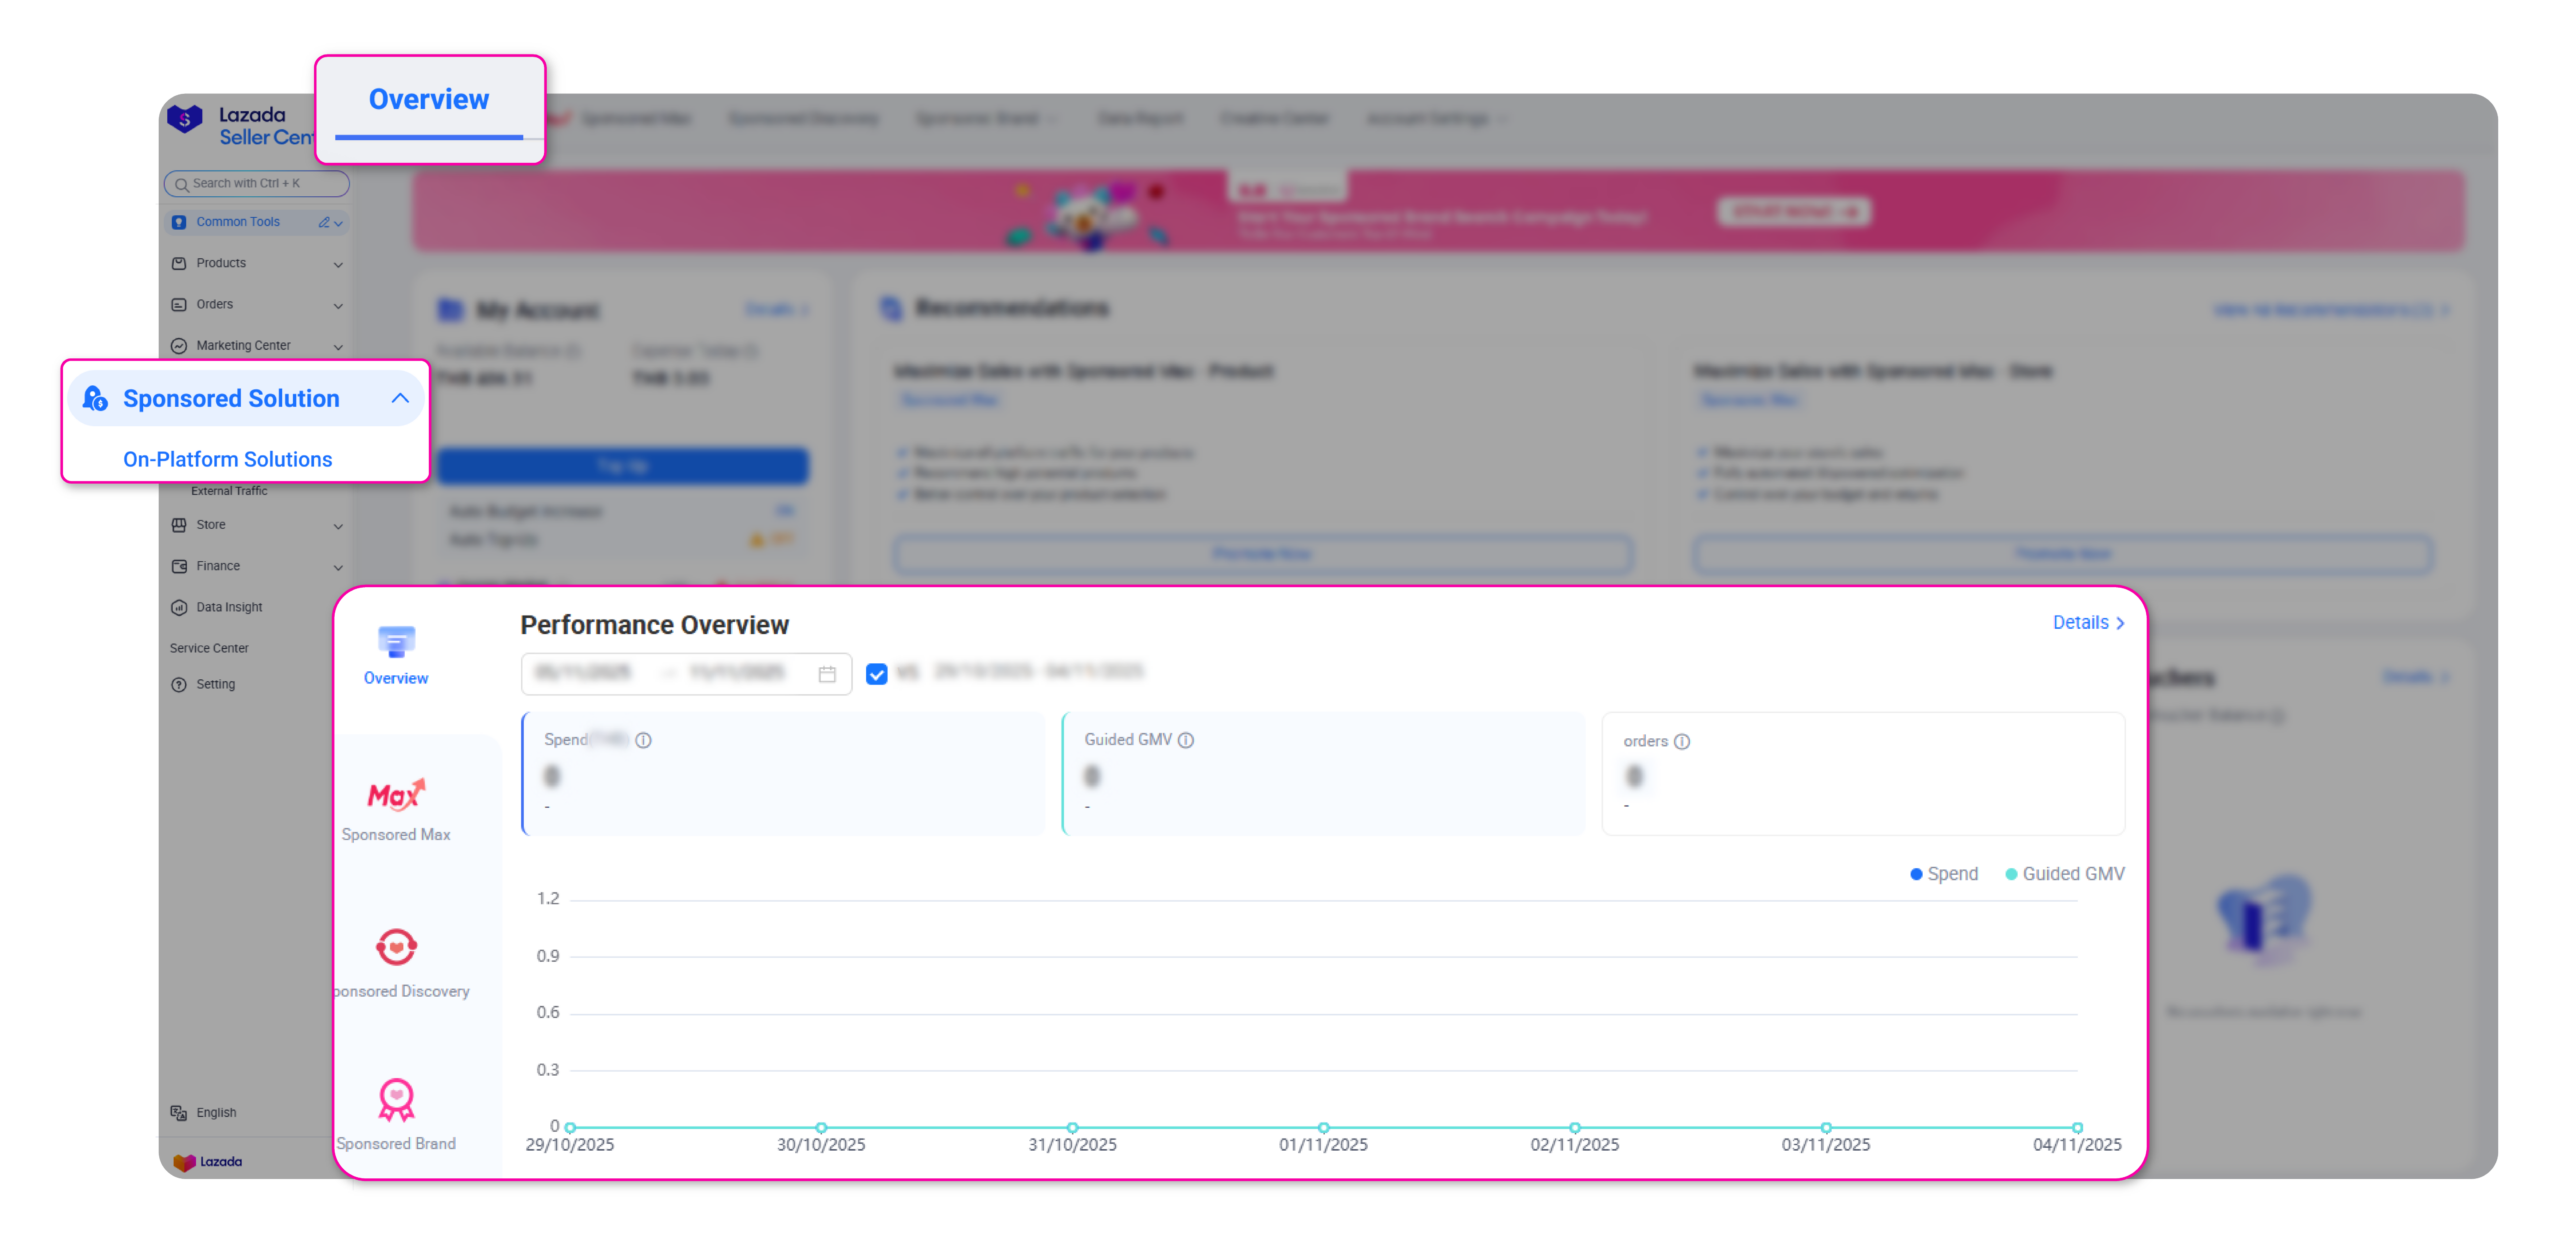
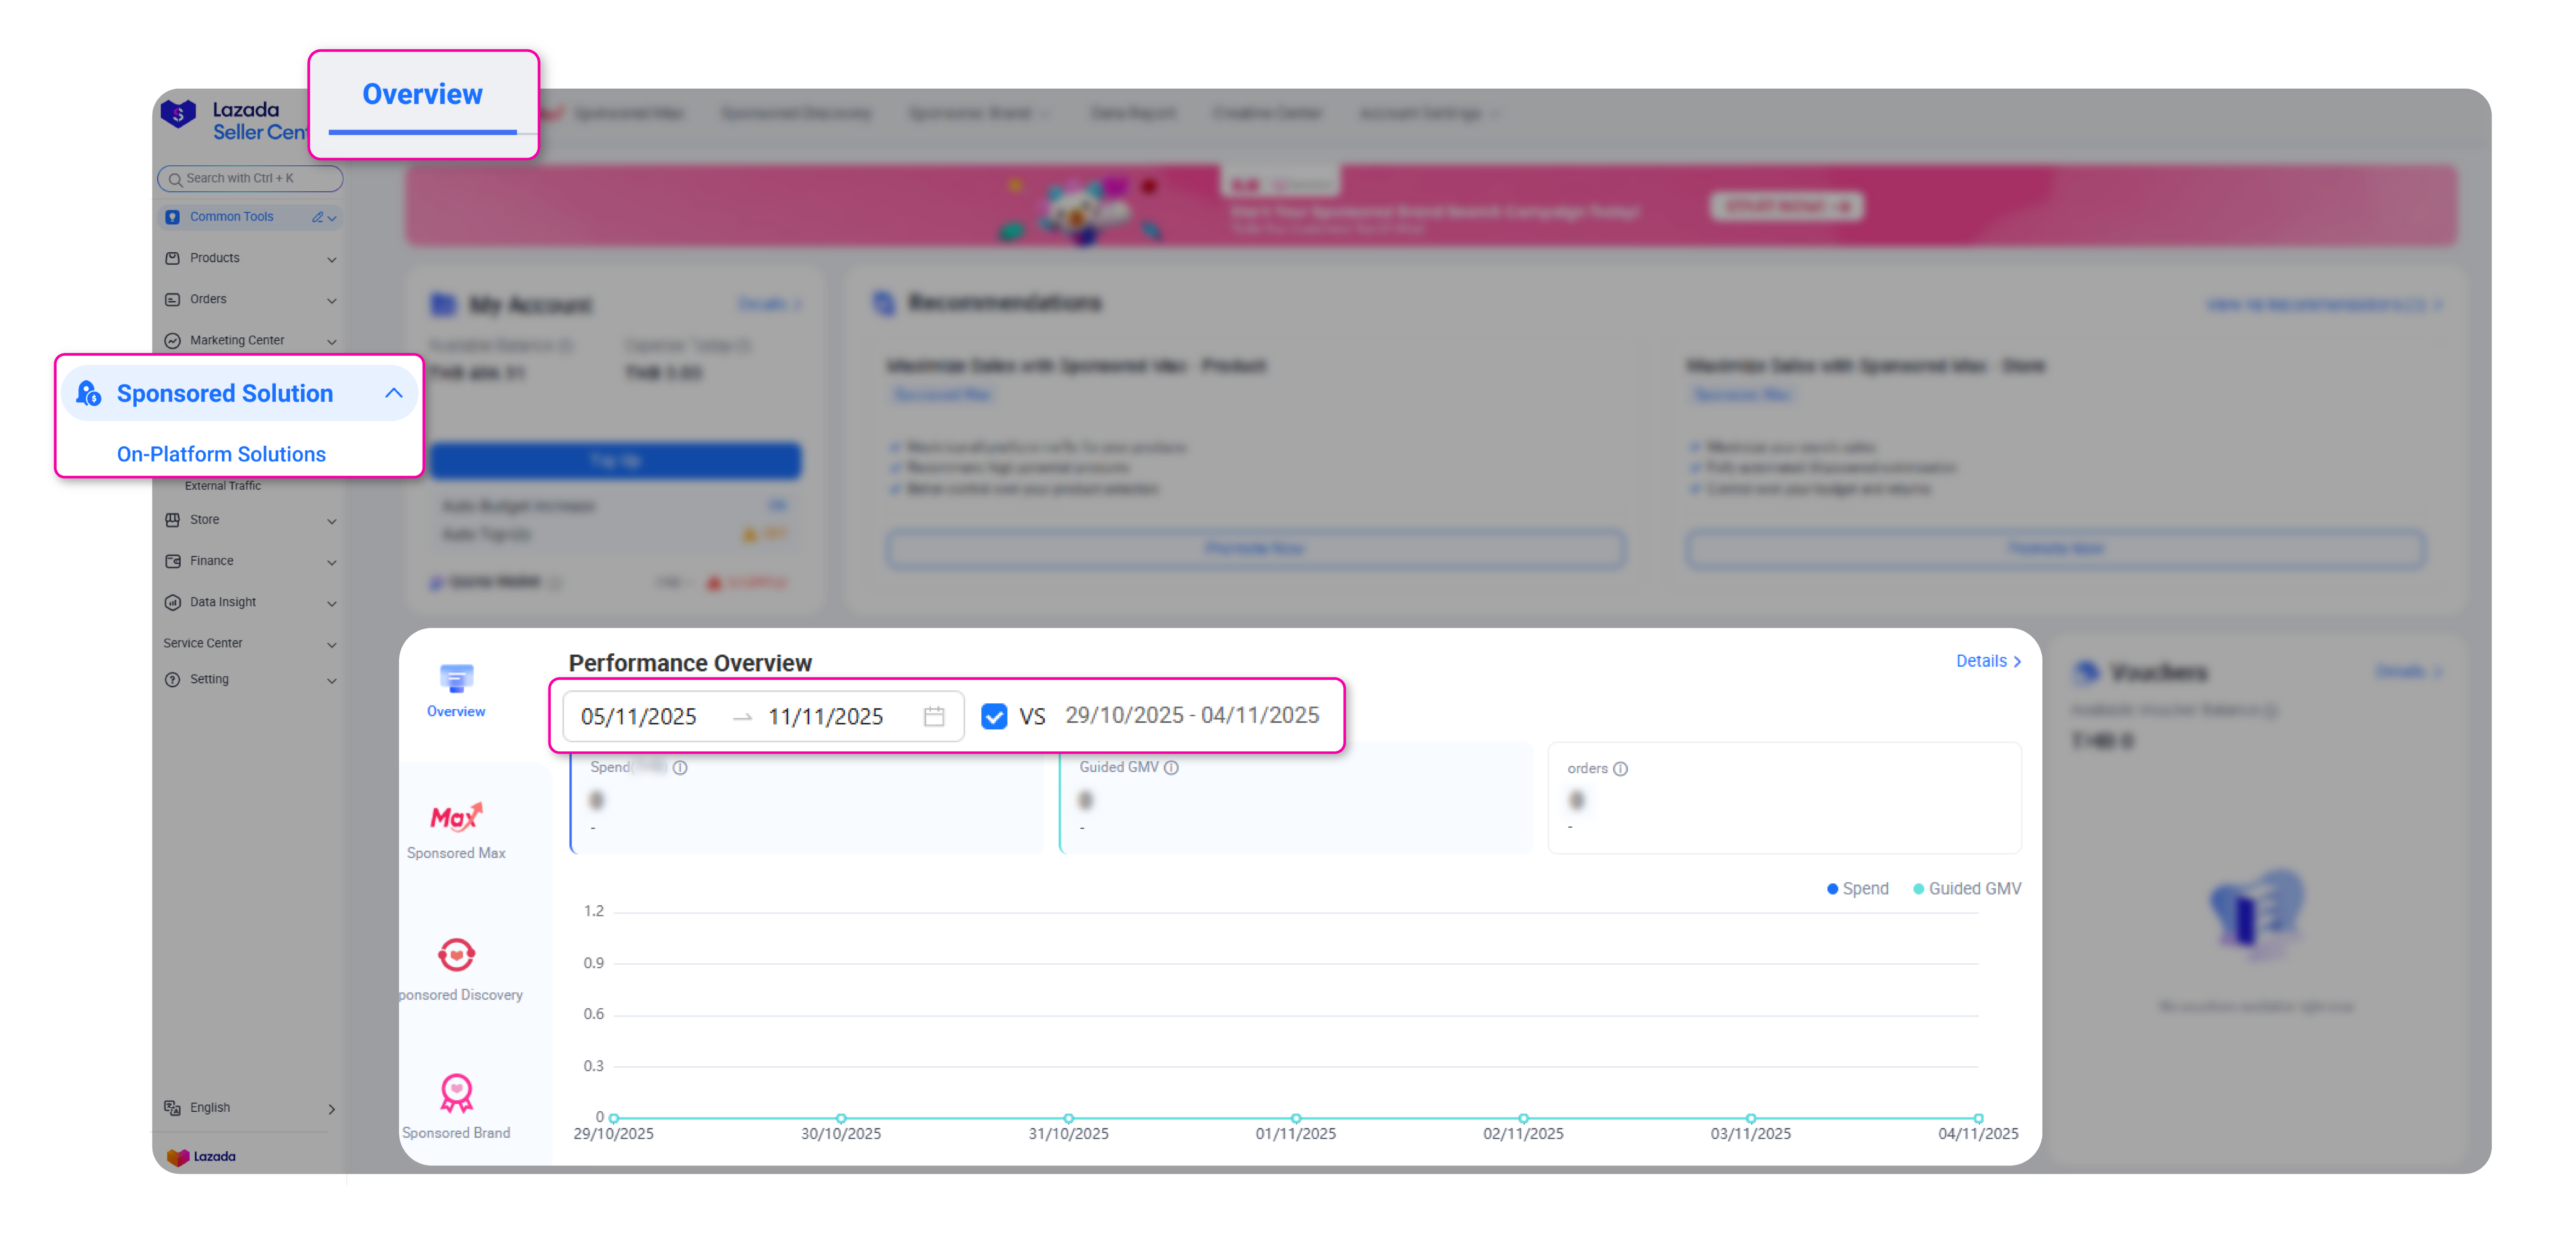
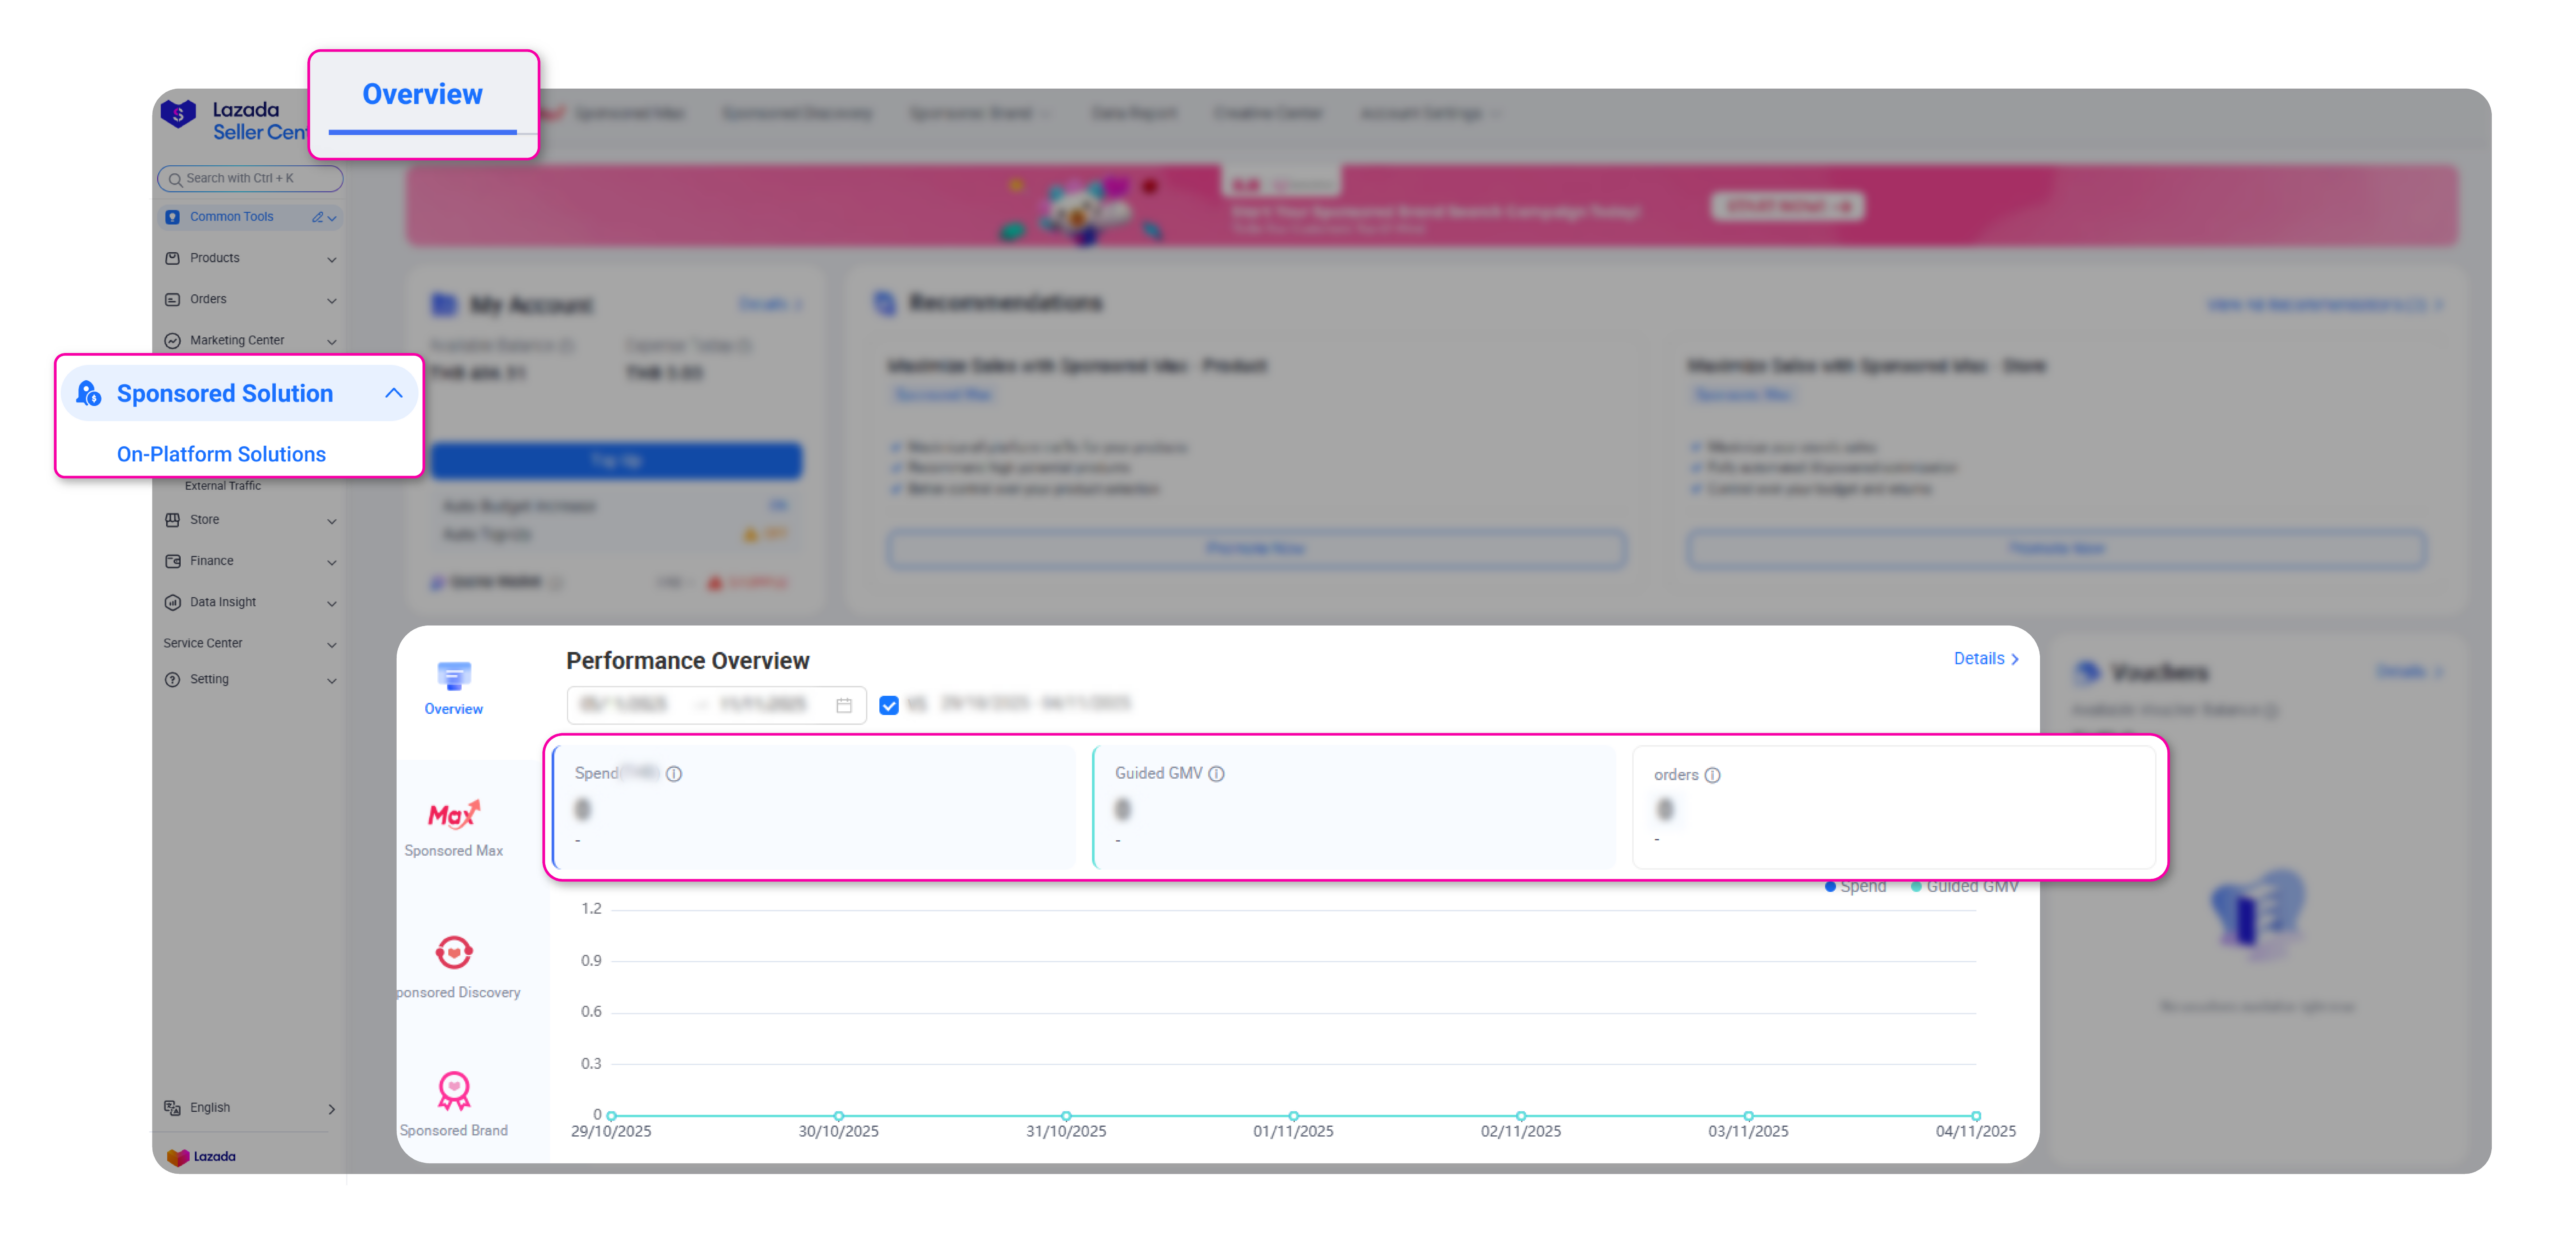
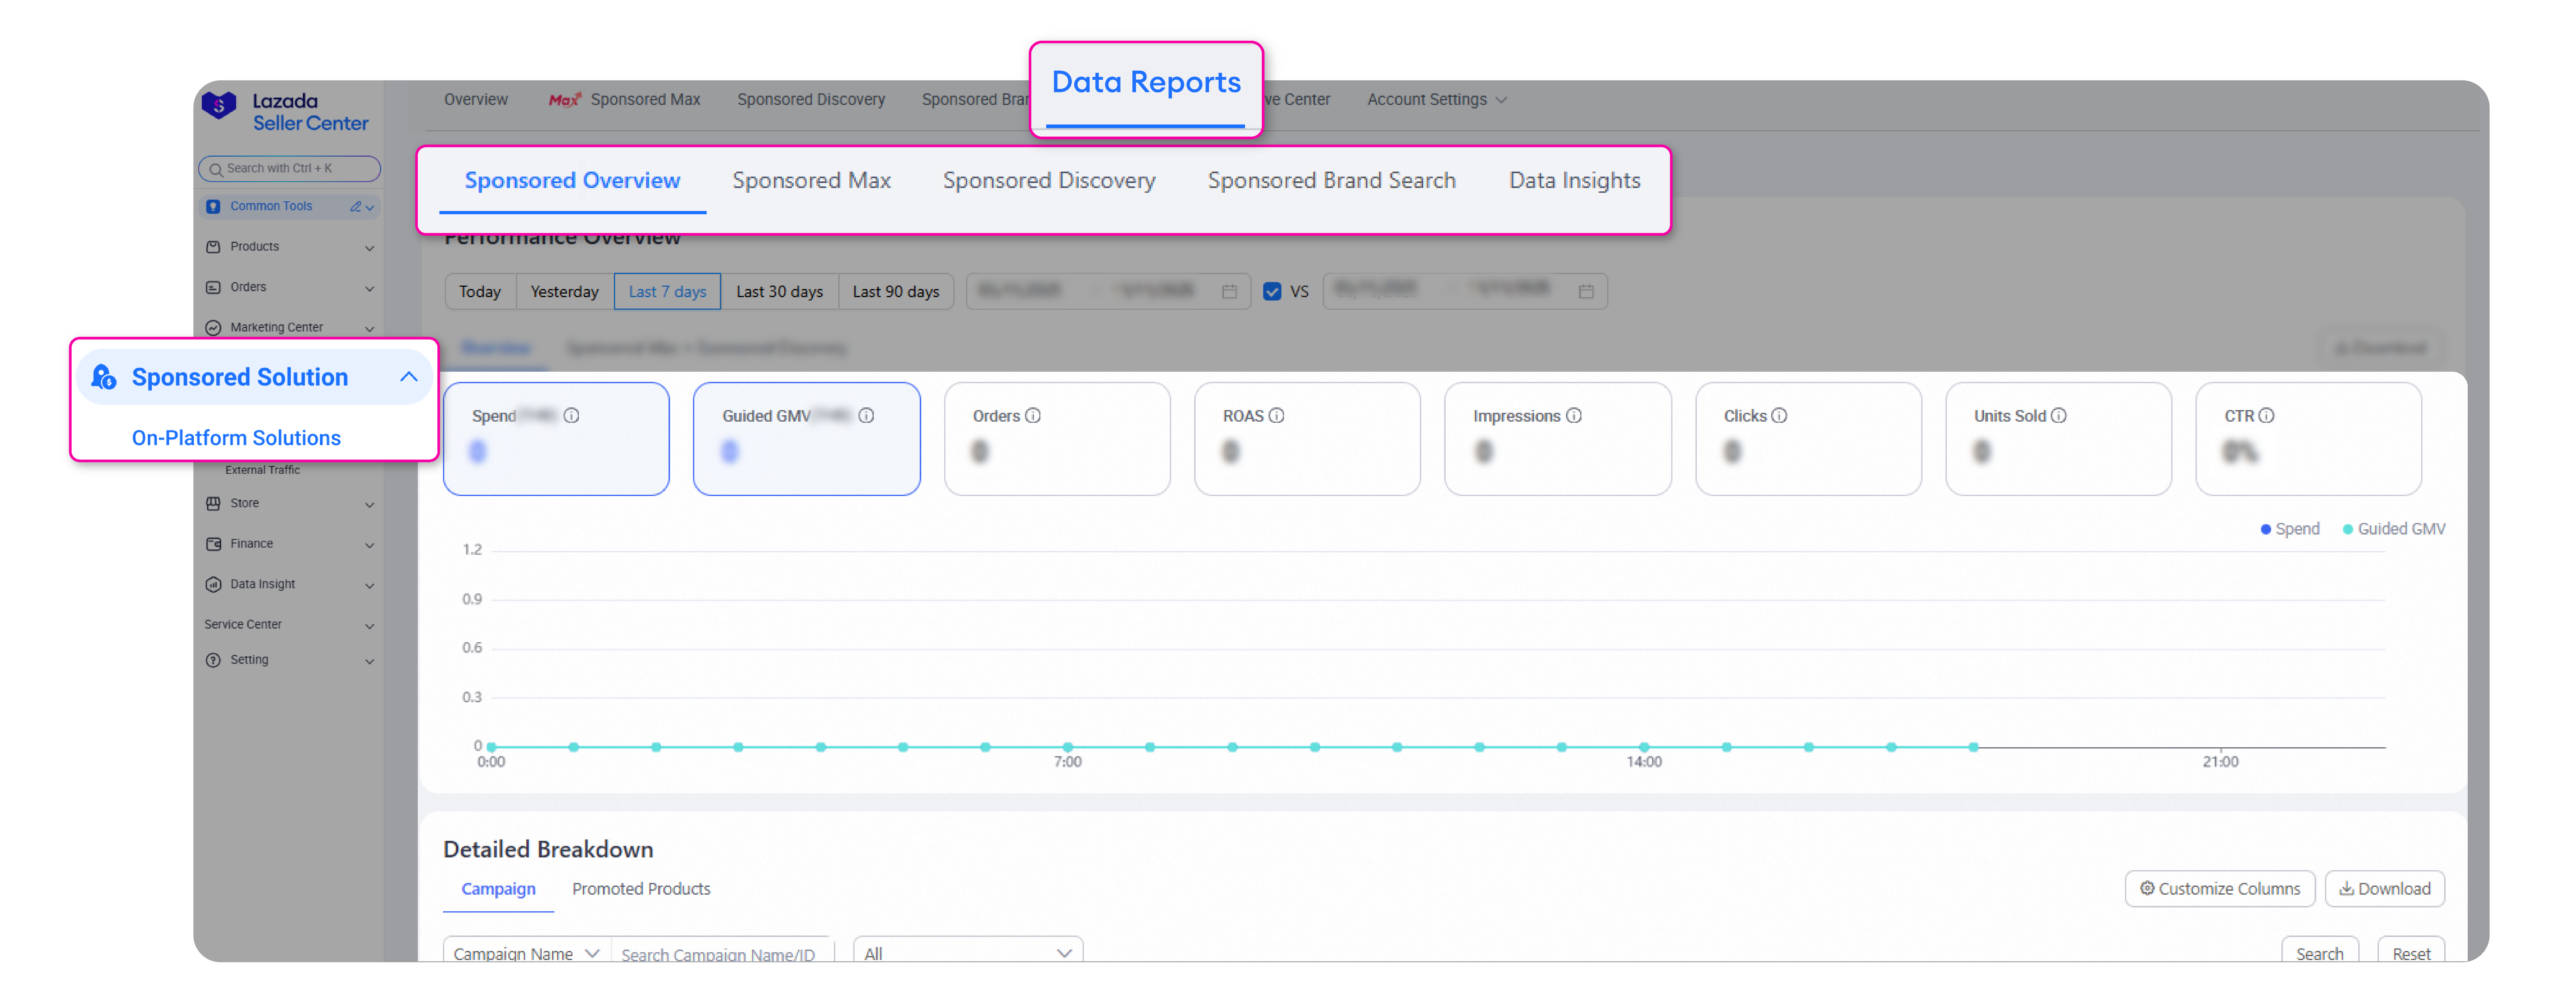
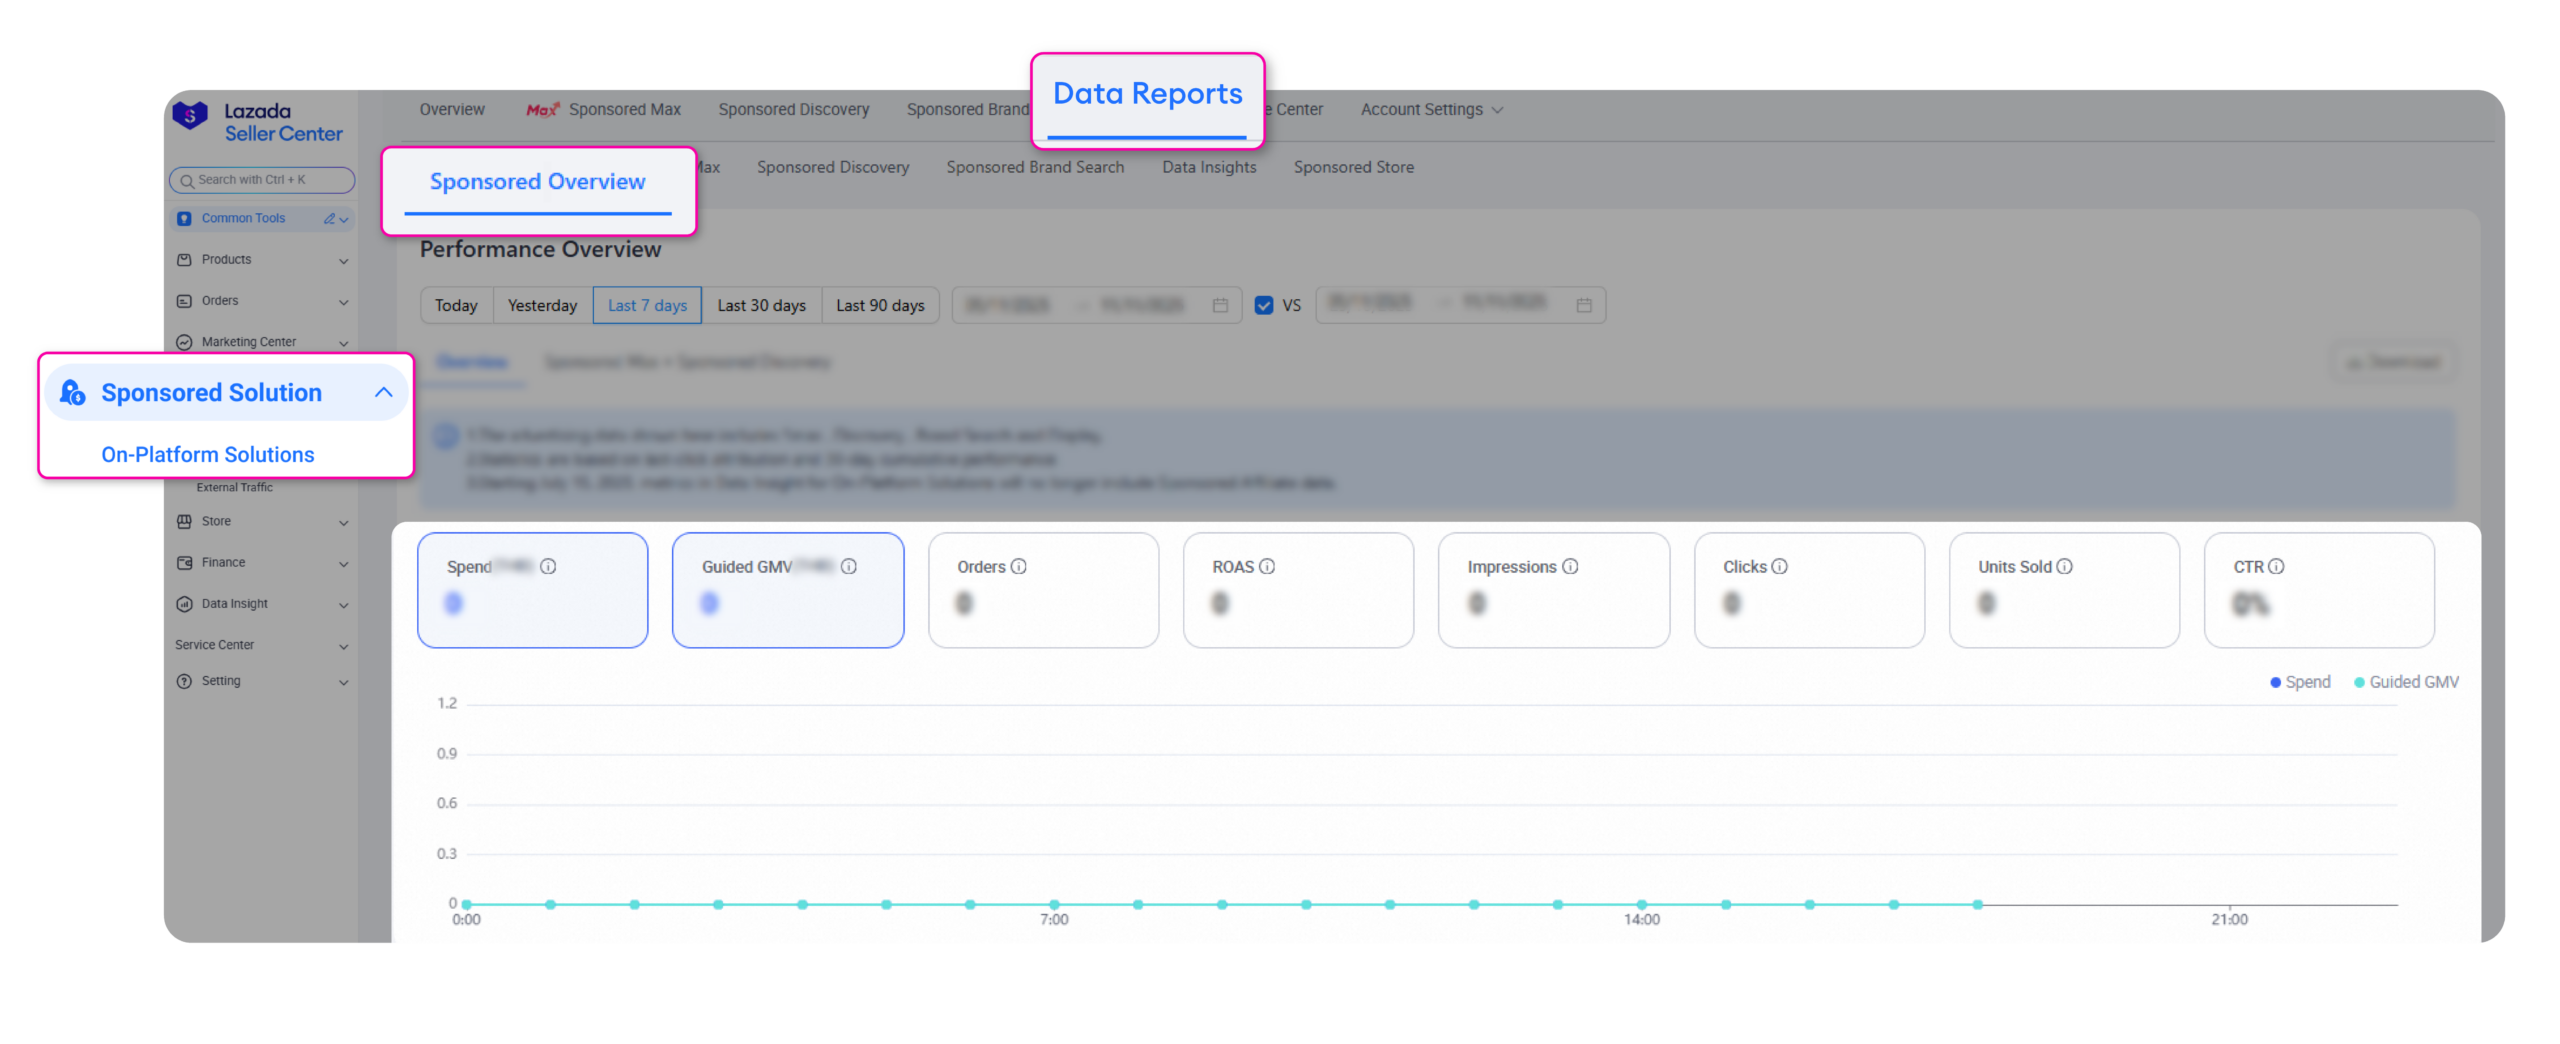
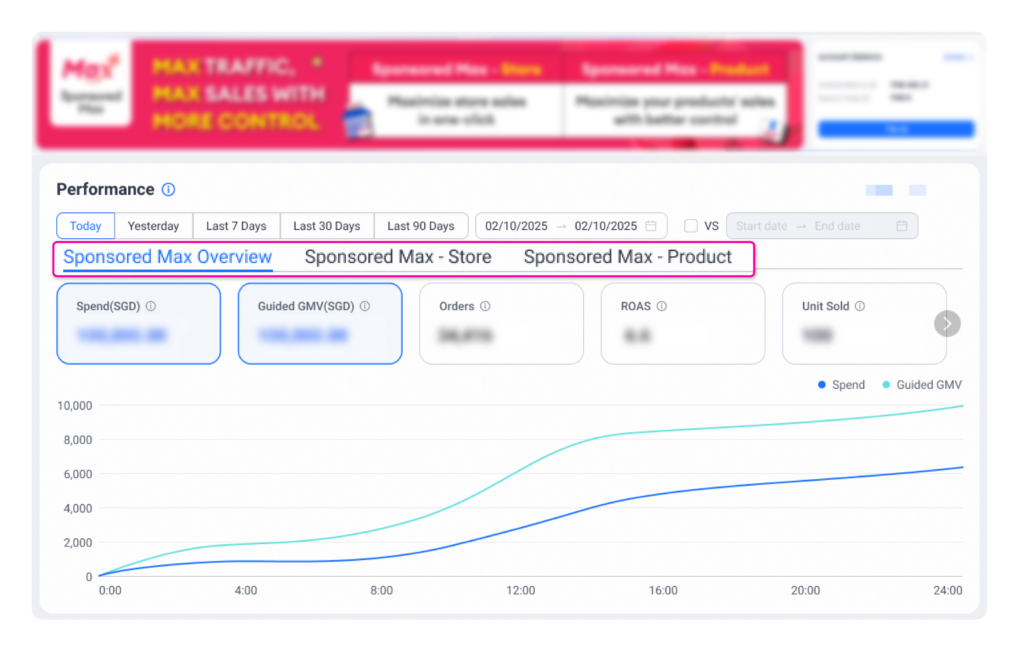
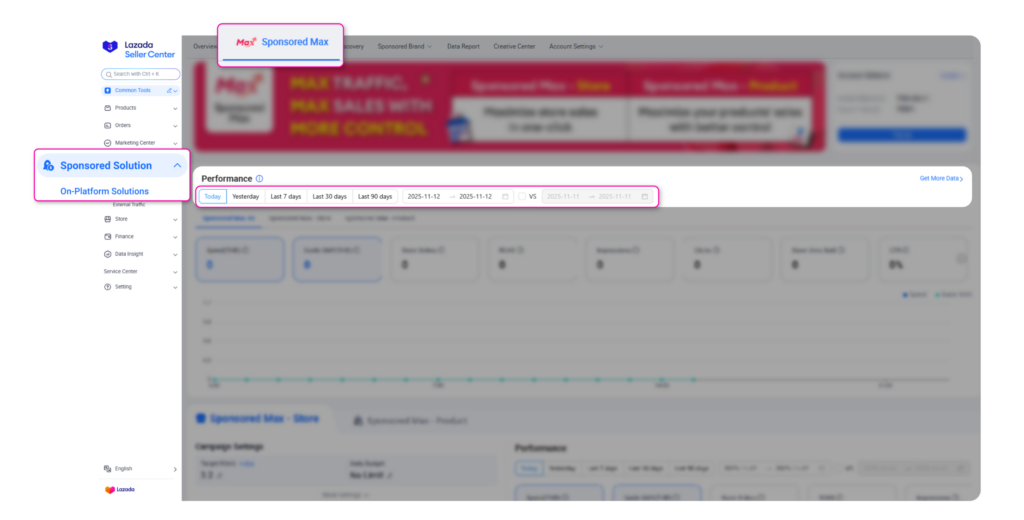
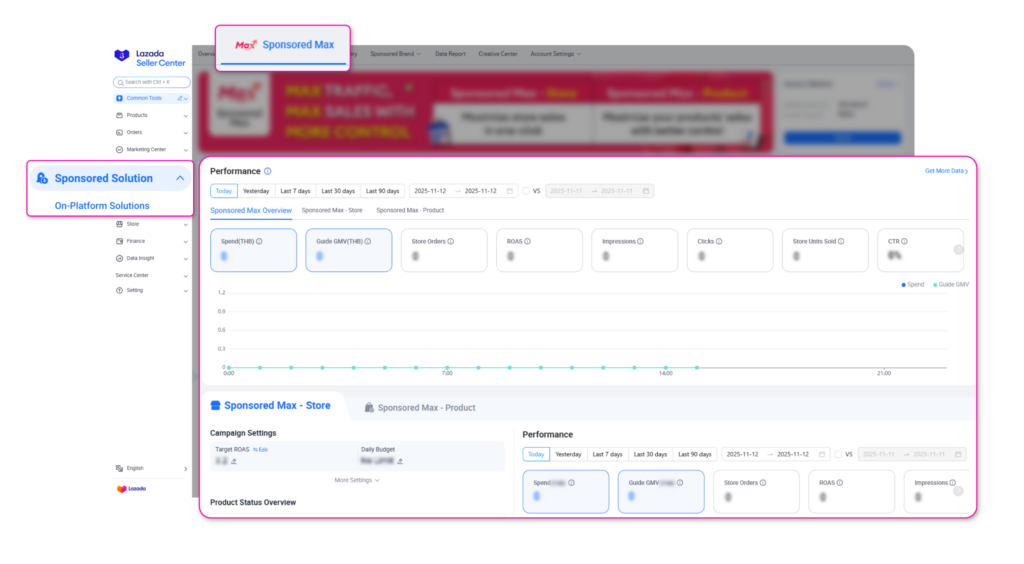
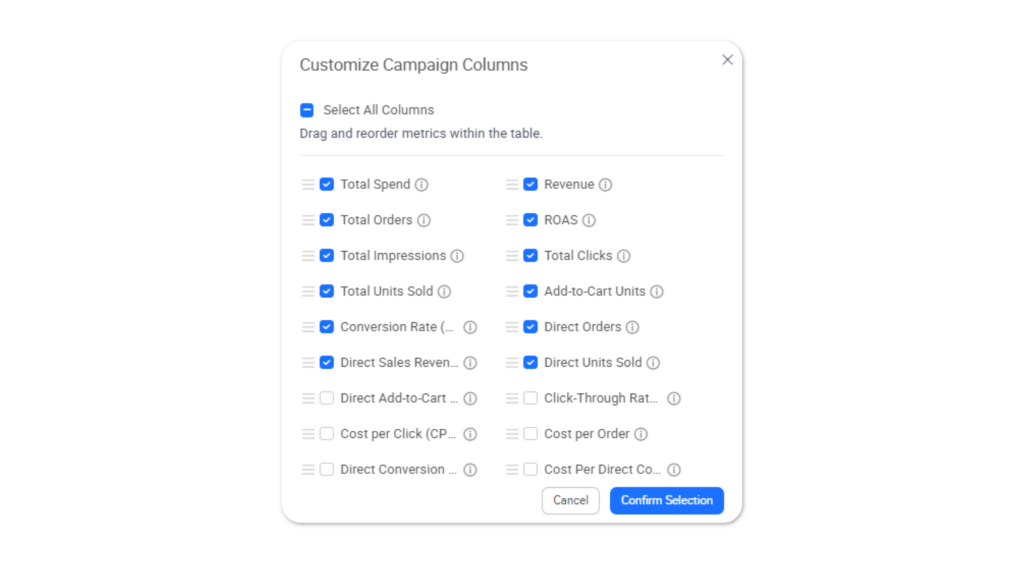
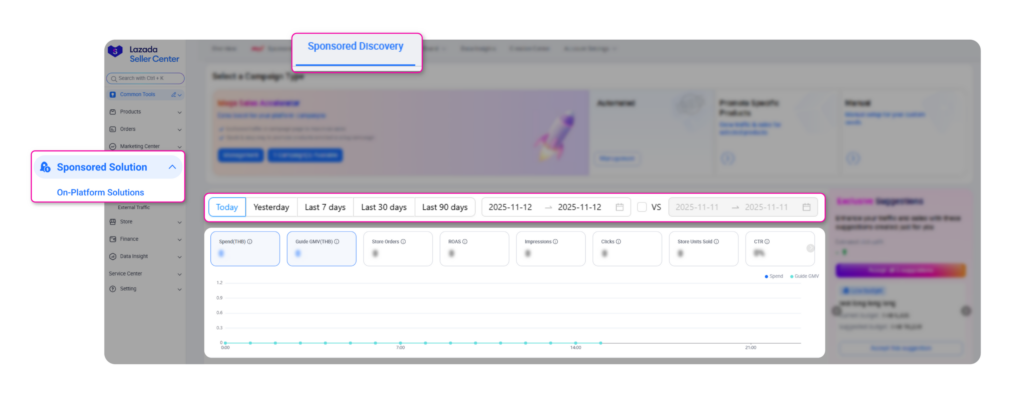
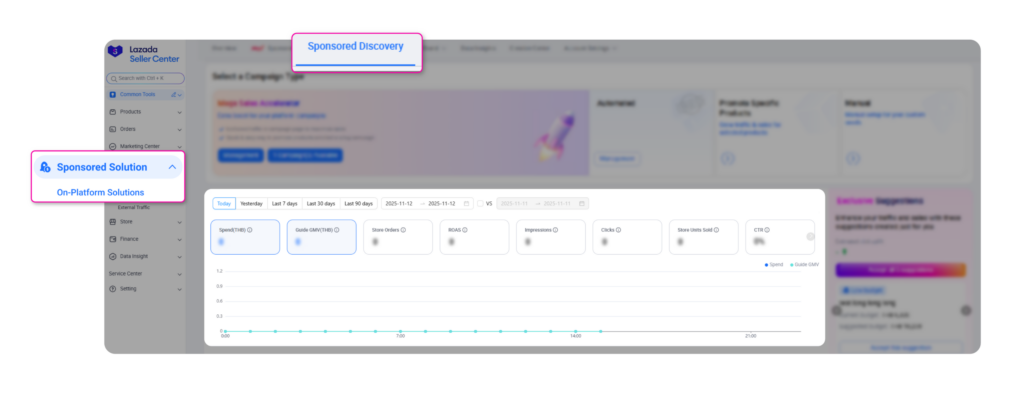
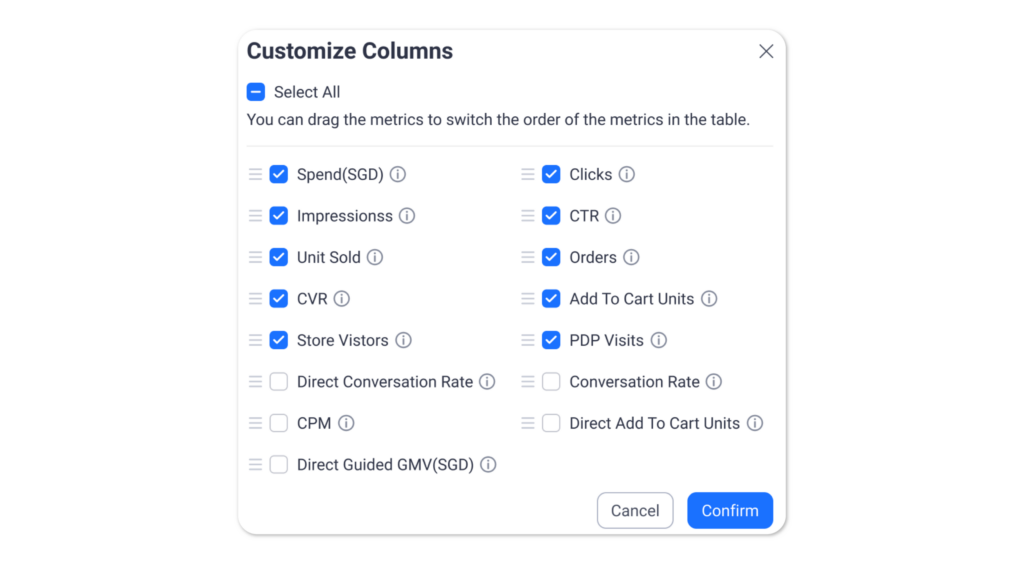
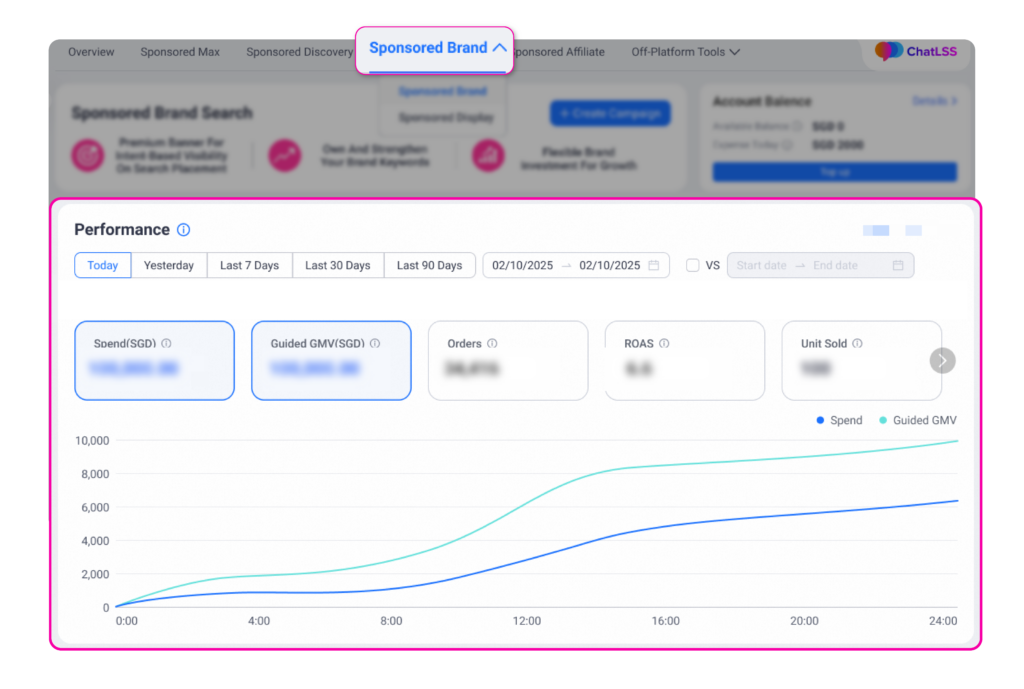
| The total amount spent on On-Platform Solutions during the selected period. |
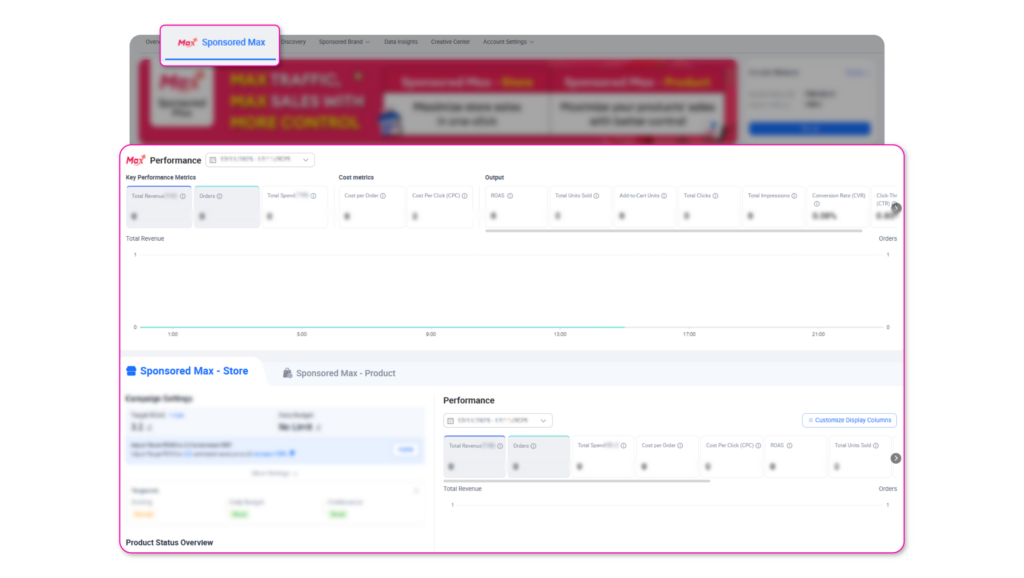
| The total number of orders generated within a 30-day last-click attribution window. Each order is attributed to the date the shopper clicked on your promoted product, not the purchase date. |
| The total revenue generated within a 30-day last-click attribution window, attributed to the clicked date rather than the purchase date. |
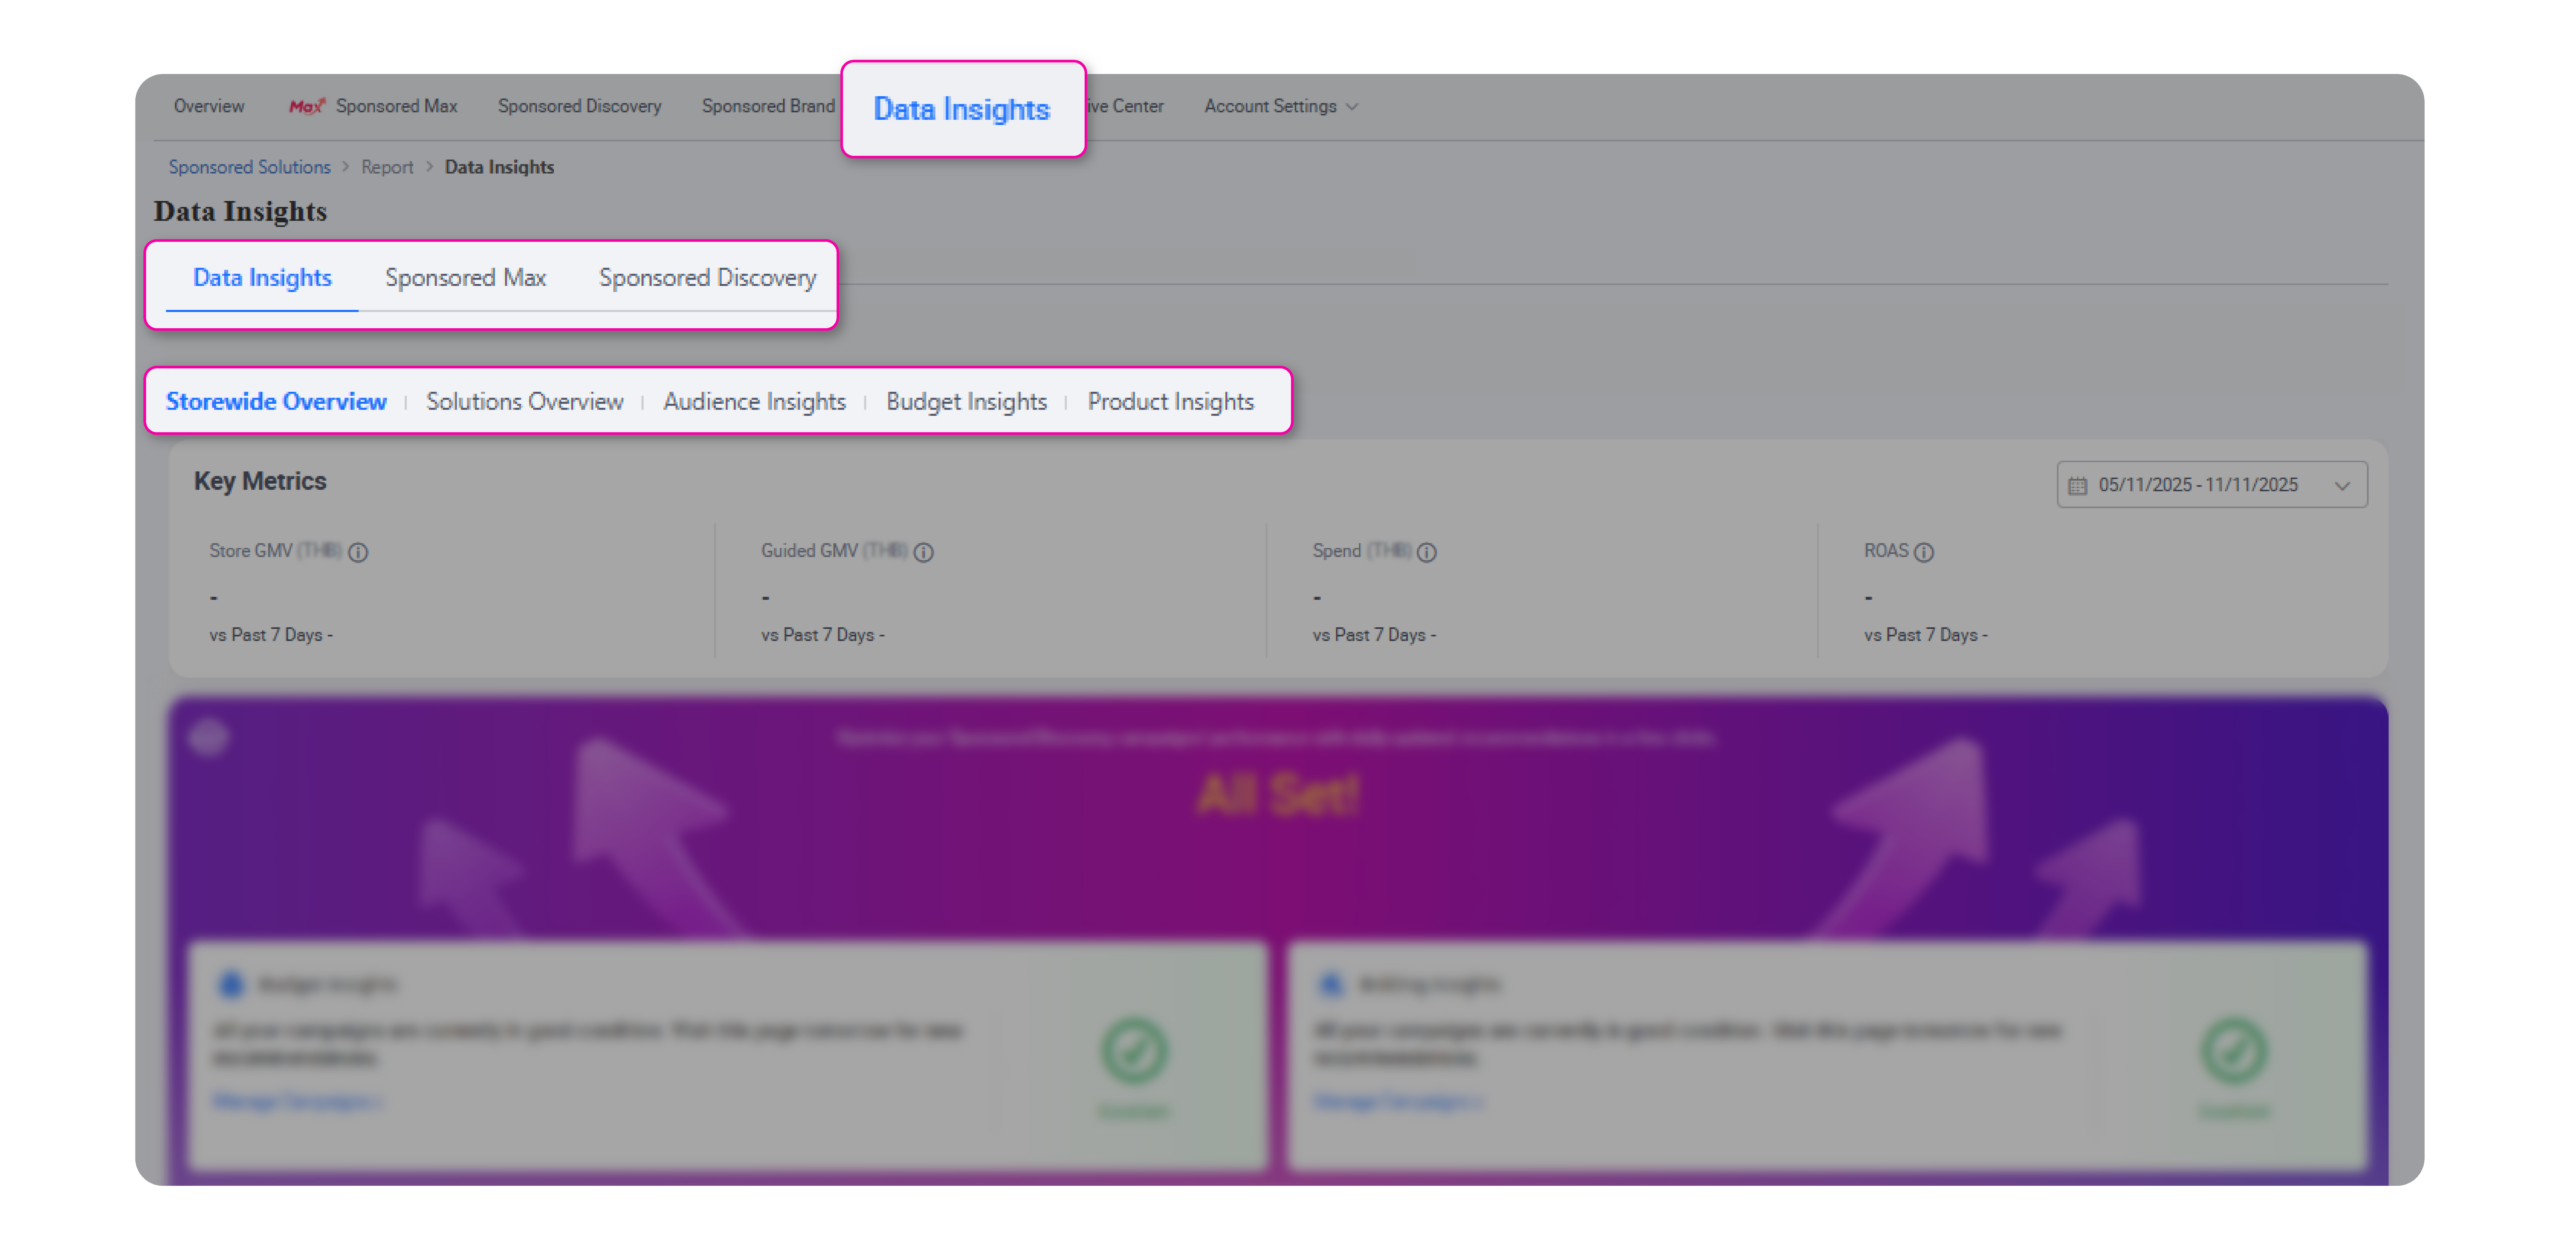
ROAS (Return on Ad Spend) | Measures how much revenue is generated relative to spent on On-Platform Solutions. ROAS = Guided GMV ÷ Amount Spent. |
ROI (Return on Investment) | Measures how much revenue is generated relative to spent on On-Platform Solutions. ROI = Guided GMV ÷ Amount Spent. |
| The total number of units sold within a 30-day last-click attribution window, attributed to the clicked date. |
| The total number of times shoppers viewed your promoted products. |
CPM (Cost per 1,000 impressions) | The average spent on On-Platform Solutions per 1,000 impressions. CPM = (Amount Spent ÷ Impressions) × 1,000 |
| The number of times shoppers clicked on your promoted products. Repeated clicks from the same shopper within a short time frame are filtered out. |
| The ratio of how often shoppers who see your promoted products click on them. CTR = (Clicks ÷ Impressions) × 100%. |
| The average spent on On-Platform Solutions incurred for each order. CPO = Amount Spent ÷ Orders. |
| The average spent on On-Platform Solutions for each click. CPC = Amount Spent ÷ Clicks. |
| The percentage of clicks that resulted in an order. CVR = (Orders ÷ Clicks) × 100%. |
| The total number of units added to cart by shoppers after clicking your promoted products, measured within a 30-day last-click attribution window. |
| The total number of direct orders placed from your store after a shopper clicked your promoted products during the selected period. |
| The total number of units sold directly within a 30-day last-click attribution window, attributed to the clicked date. |
| The total number of units directly added to cart by shoppers after clicking your promoted products. |
| The total revenue directly generated from clicks on your promoted products within a 30-day last-click attribution window, attributed to the clicked date. |
| The total number of sessions where shoppers viewed your store or product pages. Multiple visits from the same shopper are counted separately. |
| The number of unique shoppers who visited your store page at least once during the selected period. |
PDP Visits (Product Detail Page Visits) | The total number of times shoppers viewed individual product detail pages in your store. |